Receive notifications from Uptime Kuma
Uptime Kuma is a lightweight, self-hosted monitoring tool. It supports out of the box many types of notifications to alert third-party systems when a service goes down.
In this tutorial, we will setup Uptime Kuma to send notifications to FlowG using the Webhook notification.
Setting up Uptime Kuma
First, run the Uptime Kuma container:
docker run -d \
  --name uptime-kuma \
  -v uptime-kuma:/app/data \
  -p 3001:3001 \
  louislam/uptime-kuma:1
You can now access Uptime Kuma at http://localhost:3001.
Set up an admin user and create a test monitor. For testing purposes, we will create an HTTP check to query HttpBin at the following URL:
https://httpbin.org/status/200,400,500
This will randomly return a 200, 400 or 500 status code.
Then, let's create a webhook notification:
| Field | Value | Comment |
|---|---|---|
| Notification Type | Webhook | We will send the notification directly on a pipeline |
| Friendly Name | FlowG | You can use any value you want |
| Post URL | http://localhost:5080/api/v1/pipelines/default/logs | Adjust this URL to send the logs to the desired pipeline, here default |
| Request Body | Custom Body | In order to build the request body the FlowG pipeline endpoint expects |
Request Body:
{
  "record": {
    "message": "{{ msg }}",
    "monitor.name": "{{ monitorJSON['name'] }}",
    "heartbeat.status": "{{ heartbeatJSON['status'] }}",
  }
}
Then, enable the additional headers and type in the following:
{
  "Content-Type": "application/json",
  "Authorization": "Bearer YOUR-PERSONAL-ACCESS-TOKEN"
}
Save, and let the check run.
Setting up FlowG
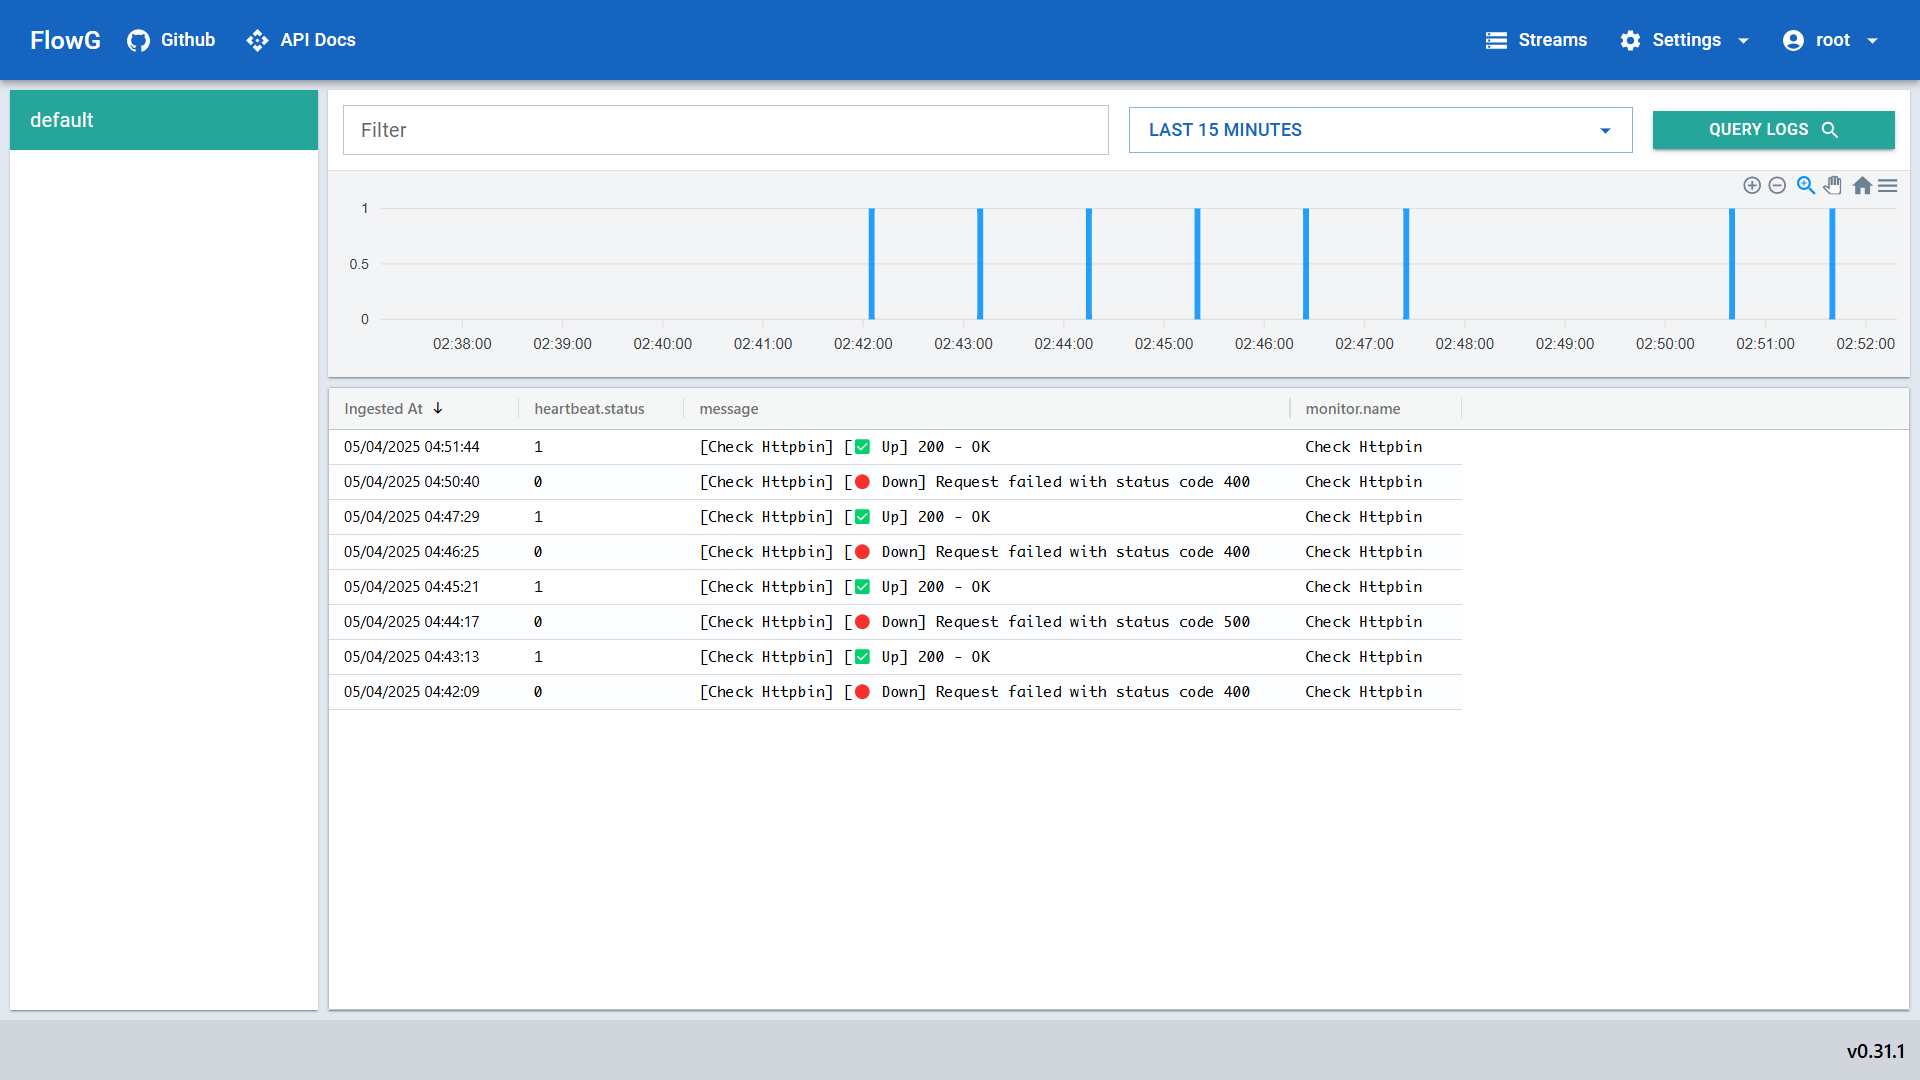
When FlowG starts for the first time, a default pipeline is created which simply
store the logs in the default stream. No further setup is required to receive
the logs from Uptime Kuma:

What's next?
You can then process the logs, refine them, parse the message, and/or forward them to a third-party system such as a remote Syslog, Datadog, or even another HTTP Webhook.
See the other guides for more ideas.