Forwarding logs to ELK
Introduction
FlowG allows you to view the logs your pipelines stored in streams. But the log viewer is pretty much barebones, as the main feature of FlowG is the pipeline itself. For that reason, you might want to forward logs to an ELK Stack, so that you can use Kibana to view your logs.
Fortunately, FlowG is able to forward logs to a remote Syslog Server, and Logstash can act as a Syslog Server to receive logs.
In this tutorial, we will setup an ELK stack using Docker Compose and a FlowG pipeline to forward logs to it.
Setting up ELK
We will be using the docker-elk project, which does the heavy lifting for us:
git clone https://github.com/deviantony/docker-elk.git
cd docker-elk
Edit the file logstash/pipeline/logstash.conf with the following content:
input {
  beats {
    port => 5044
  }

  syslog {
    port => 50000
    type => "flowg-syslog"
    grok_pattern => "<%{POSINT:flowg_syslog_priority}>%{TIMESTAMP_ISO8601:flowg_syslog_timestamp} %{SYSLOGHOST:flowg_syslog_hostname} %{DATA:flowg_syslog_program}(?:\[%{POSINT:flowg_syslog_pid}\])?: %{GREEDYDATA:flowg_syslog_content}"
  }
}

filter {
  if [type] == "flowg-syslog" {
    json {
      source => "flowg_syslog_content"
      target => "flowg_record"
    }
  }
}

output {
  elasticsearch {
    hosts => "elasticsearch:9200"
    user => "logstash_internal"
    password => "${LOGSTASH_INTERNAL_PASSWORD}"
  }
}
Finally, start the stack using the following commands:
docker compose up setup
docker compose up
This can take a few minutes, then you can access Kibana at:
With the following credentials: elastic / changeme.
Setting up the FlowG pipeline
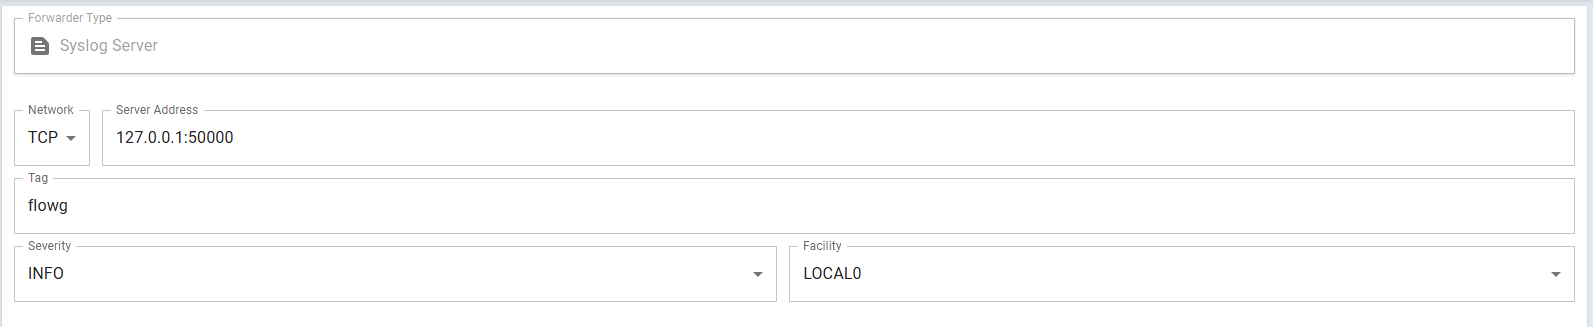
First, let's create a "Syslog Forwarder" named elk, with the following
configuration:
| Property | Value | Comment |
|---|---|---|
| Network | TCP | UDP works as well, Logstash starts a listener for each protocol |
| Server Address | 127.0.0.1:50000 | Assuming your FlowG is running on the same host as the ELK stack we started above |
| Tag | flowg | You can use any value you want actually |
| Severity | INFO | You can use any value you want |
| Facility | LOCAL0 | You can use any value you want |
Then, create a pipeline that forwards logs to the elk forwarder:
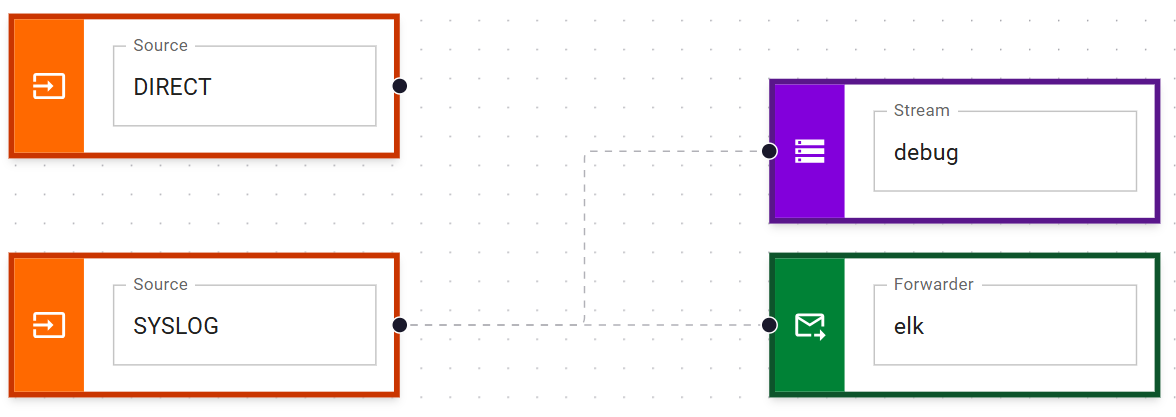
And that's it!
Testing
You can test the setup by sending a log to the pipeline using the logger
command:
logger -n localhost -P 5514 -t myapp 'hello world'
You can then find your log in Kibana at the following URL:
